A different way to look at the housing market
where will housing go next?


Imagine you’re in the market for a house. You found the perfect one. What is the one factor that will determine if you buy it? Is it the price? No. At least, not exactly. In an interesting exception to other markets, the price of the house is not what you’re paying.
What you really care about is your monthly carrying costs - your mortgage, property tax, insurance etc. More specifically, it’s the monthly payments relative to your monthly income. My claim is this relationship should gravitate towards some constant. To explore that further, I used official data from FRED to create the following chart:
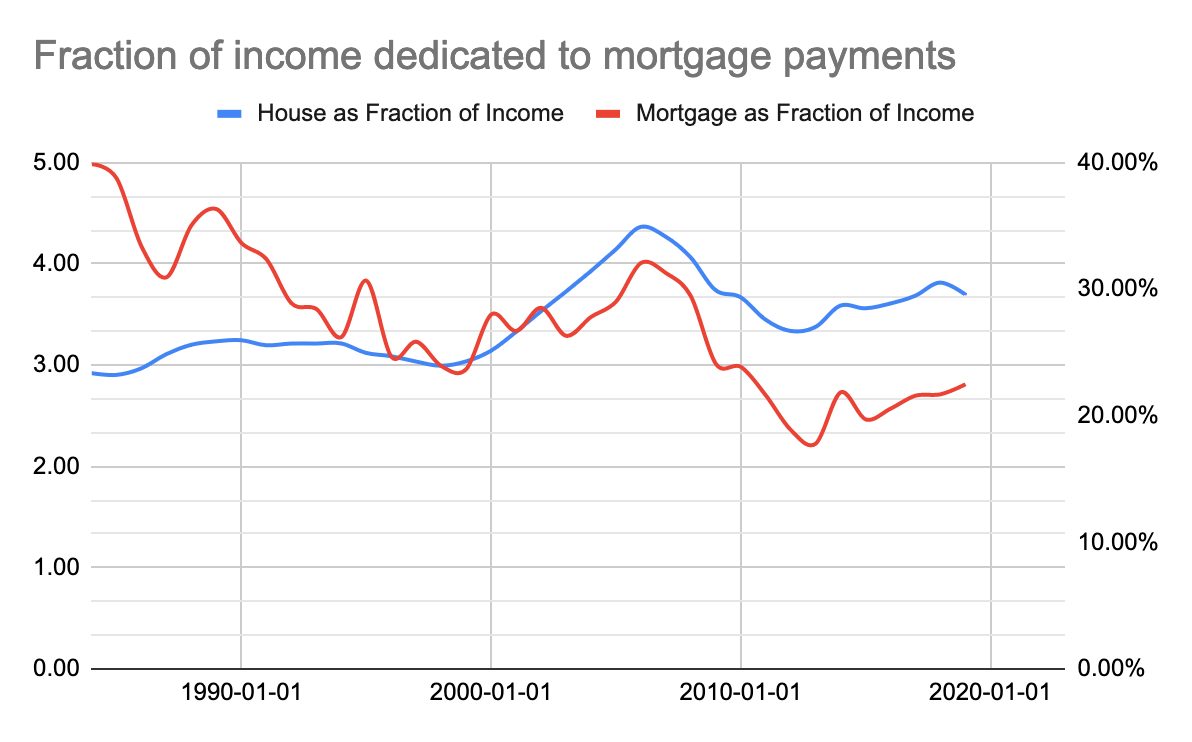
The red line, with the y-axis on the right, represents the relationship between average mortgage payments and average household incomes. In 1984, with a 13% mortgage rates (yes, really), the average house, financed, would have run you about 40% of your household income. On the other hand, in 2019, with mortages averaging around 4%, an average house would have taken up just 21% of a households income - A 50% discount over 1984. That helps explain why houses seemed so expensive - but they weren’t.
The blue line represents the relationship between the cost of an average house and average household incomes. In 1984, a house cost $65,000 and the household income clocked in at around $22,500. That translates to an average house being a 3x multiplier of the average household income. In 2006, the average house shot up to $210,000 while incomes grew to $48,000. That is a multiplier of 4.5x. From that perspective, houses were 50% more expensive to buy in 2006 compared to 1984.
With these two pespectives in mind, you can start to understand what happened to the housing market. The key is when financing a mortgage is expensive, houses are cheap. When mortgages are cheap, houses are expensive. There’s one important exception to this - the 2008 global financial crisis - but we all know how that ended.
Now let’s take a look at this relationship with data post Covid.
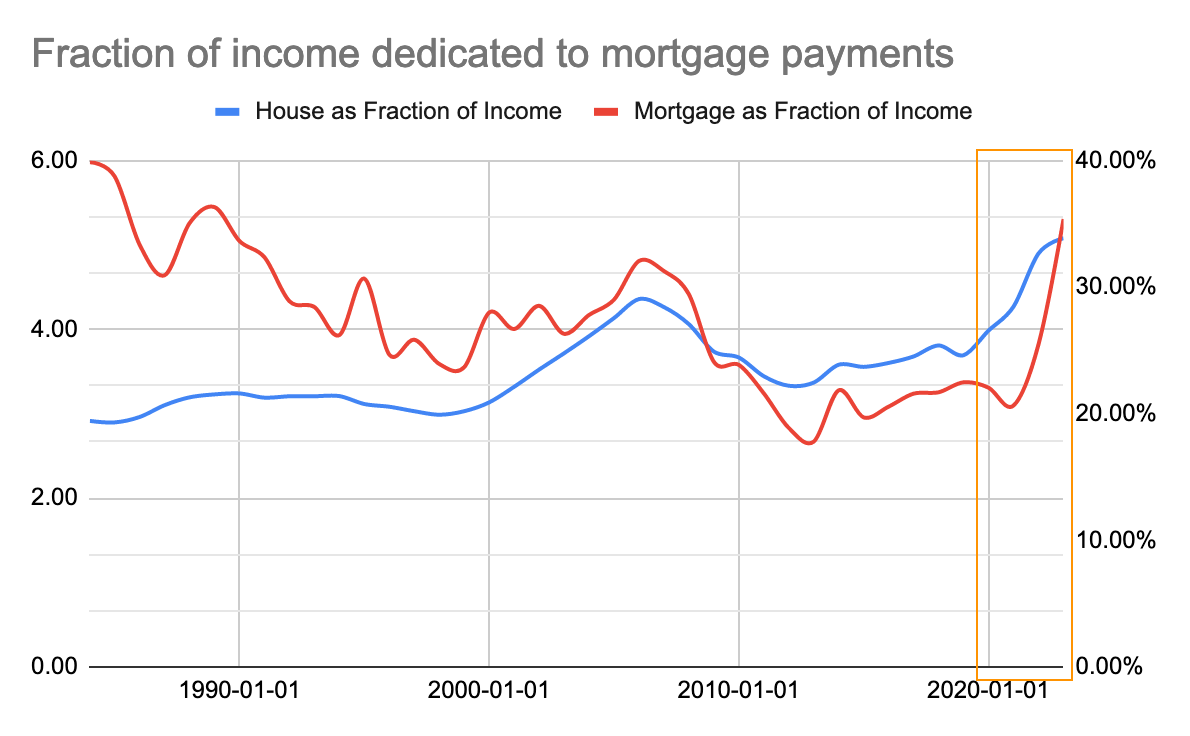
I think you can draw your own conclusions.